xnew <- seq(min(mtcars$disp), max(mtcars$disp), length.out = 100)
layout(rbind(1,2), heights = c(5,3))
old <- par(oma=c(3, 3, 3, 3), mar=c(1, 4, 0, 0))
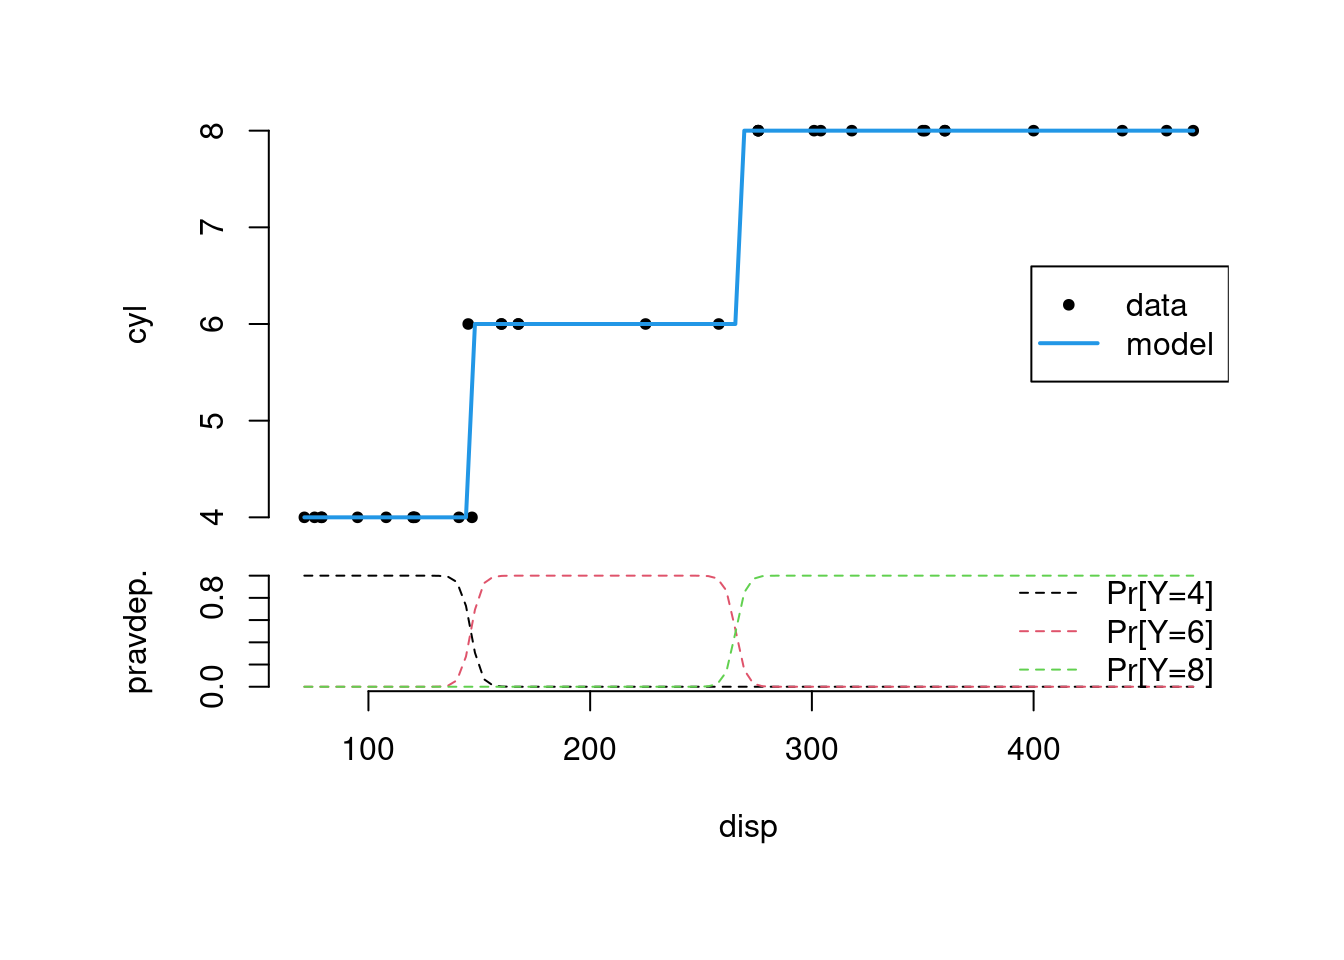
plot(cyl ~ disp, mtcars, axes=F, pch=20)
lines(x = xnew,
y = as.numeric(as.character(predict(fit, newdata = list(disp = xnew)))),
col = 4, lwd=2)
legend("right", c("data","model"), lty=c(NA,1), lwd=c(NA,2), col=c(1,4), pch = c(20,NA))
axis(2); par(mar=c(4, 4, 0, 0))
matplot(xnew, predict(fit, newdata = list(disp = xnew), type = "p"),
xlab = "disp", ylab = "pravdep.", type= "l", lty = 2, axes = F)
legend("right", c("Pr[Y=4]","Pr[Y=6]","Pr[Y=8]"), lty=2, col=1:3, bty="n")
axis(1); axis(2)