dat <- ISLR2::Wage # |> dplyr::slice_sample(n = 100)
grid <- modelr::seq_range(dat$age, 100) |>
data.frame(age = _)
# --- discontinuous ---
# function to discretize continuous variable by breaking into bins
# in: x - numeric vector to be discretized
# knots - numeric vector of breaks (without extremes)
# - single integer, number of breaks
# out: character vector indicating intervals
make_ind <- function(x, knots) {
min <- floor(min(x)); max <- ceiling(max(x))
if(length(knots) == 1 & is.integer(knots)) {
cut(x, knots + 1, right = FALSE, include.lowest = TRUE)
} else {
cut(x, c(min, knots, max), right = FALSE, include.lowest = TRUE)
}
}
# example use:
# make_ind(1:10, 3)
# make_ind(1:10, 3L)
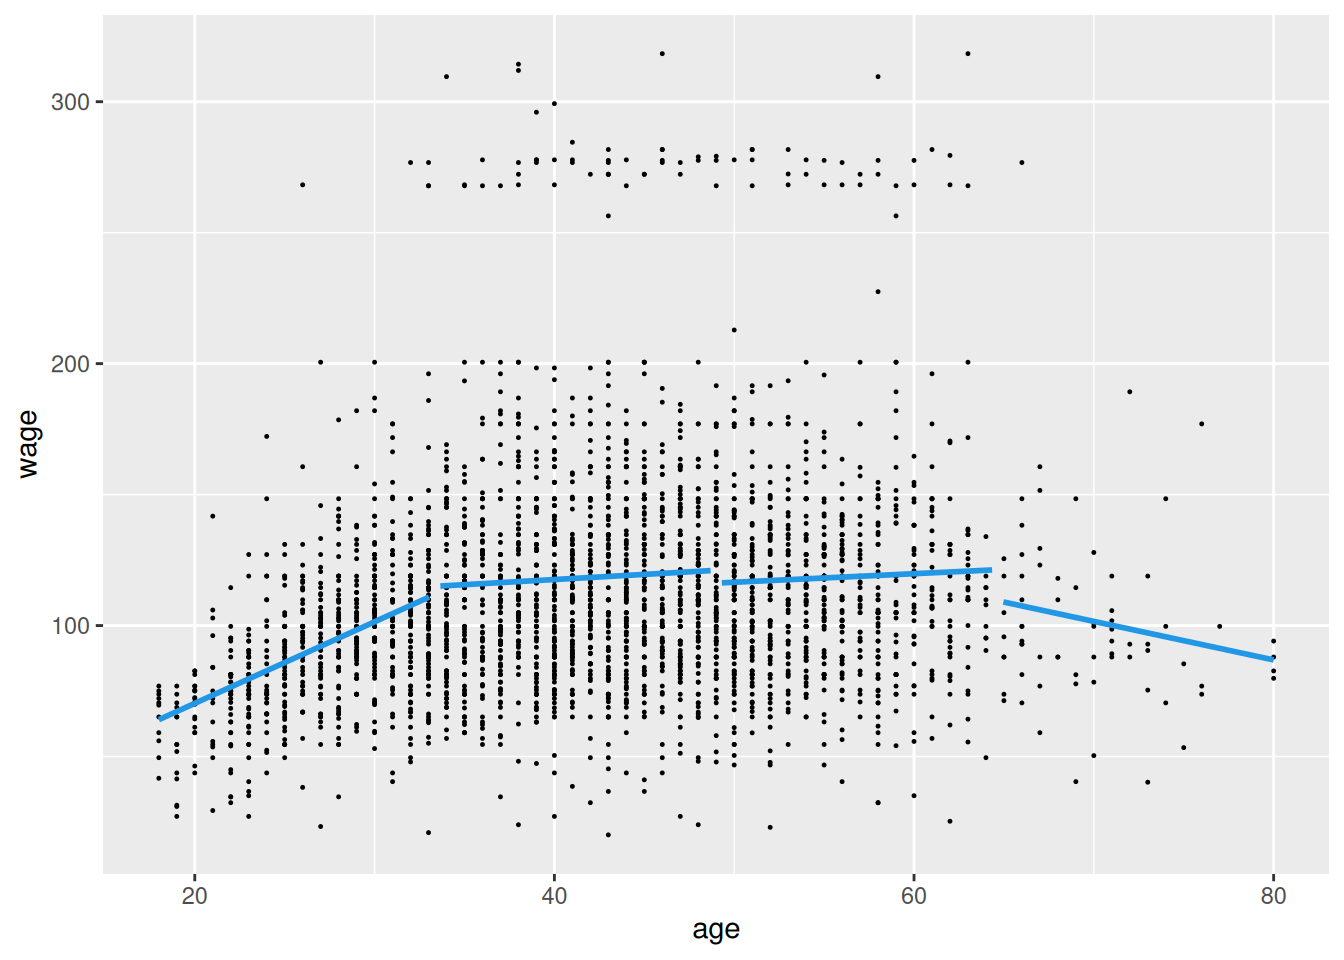
fit1 <- dat |>
dplyr::mutate(ind = make_ind(age, 3L) |> as.factor()) |>
lm(wage ~ ind*age, data = _)
grid |>
transform(ind = make_ind(age, 3L)) |>
modelr::add_predictions(fit1, var = "wage") |>
ggplot() + aes(x = age, y = wage) +
geom_point(data = dat, size = 0.2) +
geom_line(aes(group = ind), linewidth = 1, color = 4)
# --- continuous ---
# function to round a vector as much as possible while keeping elements distinguishable
# in: x - numeric vector
# add - integer, number of digits by which to increase precision (or decrease if negative)
# out: numeric vector
round_but_keep_different <- function(x, add = 0) {
x |> diff() |> abs() |> min() |> log10() |> (`-`)() |> ceiling() |> (`+`)(add) |>
round(x, digits = _)
}
# example use:
# c(1.2345, 1.2456, 1.2356) |> round_but_keep_different(add=0) # (1.23 1.25 1.24)
# c(1.2345, 1.2456, 1.2356) |> round_but_keep_different(add=1) # (1.234 1.246 1.236)
# function to apply truncated linear basis function to predictor
# in: x - numeric vector, values of predictor
# knots - numeric vector of breaks (without extremes)
# - single integer, number of interior breaks
# out: data frame, one column for each knot
make_max <- function(x, knots) {
if(length(knots) == 1 & is.integer(knots)) {
knots <- seq(min(x), max(x), length.out = knots + 2) |> head(-1) |> tail(-1)
}
out <- sapply(knots, function(k) pmax(0, x - k)) |> data.frame()
setNames(out, paste0("max(",round_but_keep_different(knots, add=1),")"))
}
# example use:
# make_max(1:10, 3L)
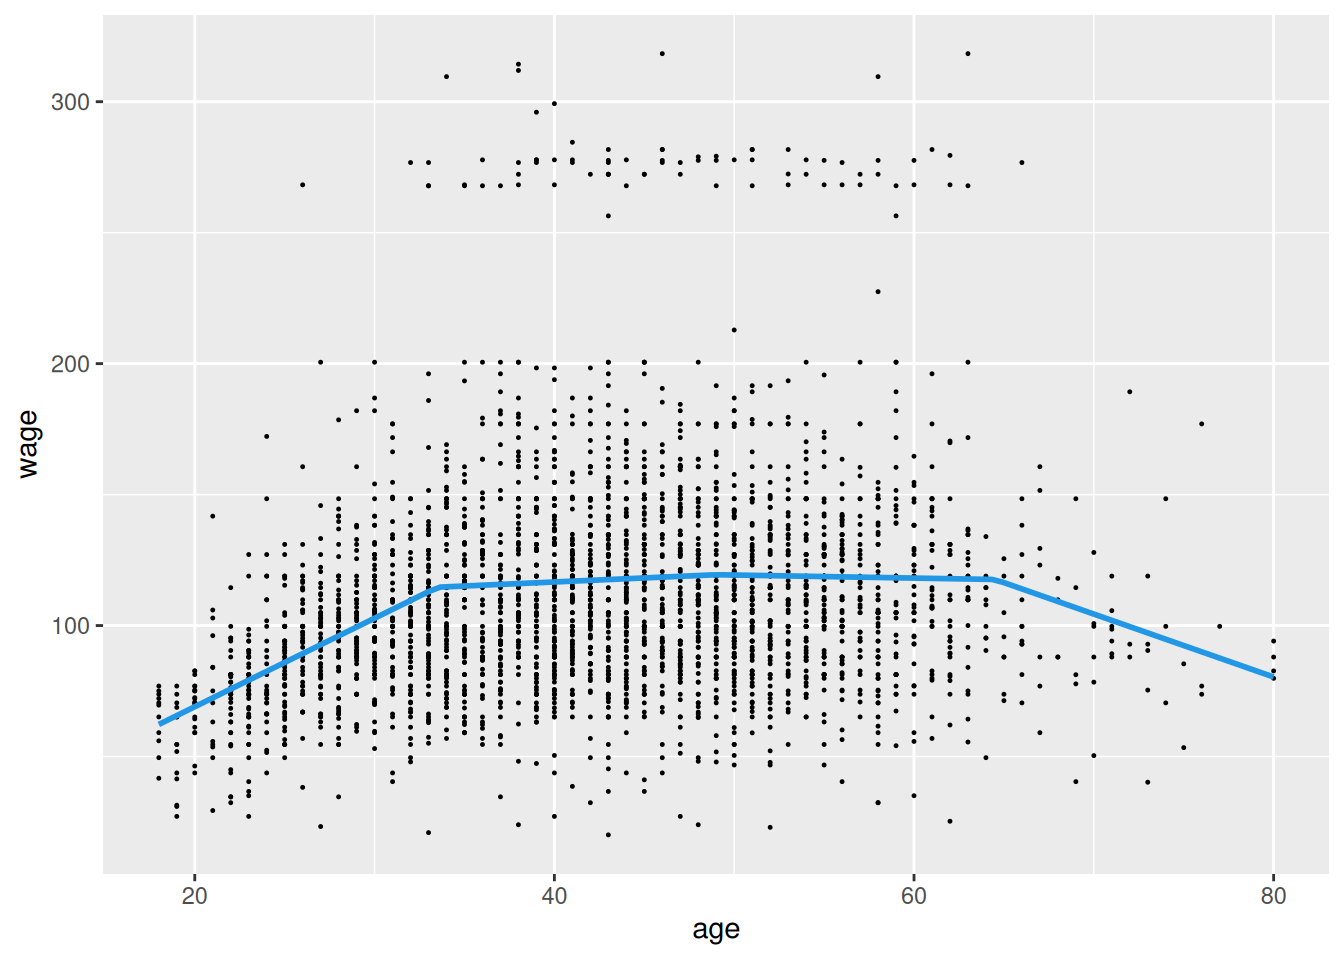
fit2 <- cbind(dat[c("wage","age")], make_max(dat$age, 3L)) |>
lm(wage ~ ., data = _)
grid |>
(\(df) cbind(df, make_max(df$age, 3L)))() |>
modelr::add_predictions(fit2, var = "wage") |>
ggplot() + aes(x = age, y = wage) +
geom_point(data = dat, size = 0.2) +
geom_line(linewidth = 1, color = 4)
# --- summary
fit1 |>
summary() |>
coef() |>
signif(2) |>
pander::pander()
fit2 |>
summary() |>
coef() |>
signif(2) |>
pander::pander()